Version 2.4.0 of Struts2 jQuery Plugin is now available with a lot of new features and improvements.
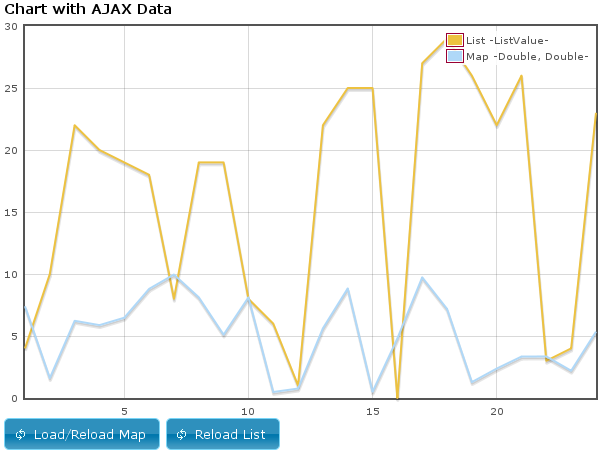
Now there exists a new Chart Module which is based on the popular jquery flot project. The new chart tag renders a chart with data given from a list or an ajax source. Checkout the new examples in the Showcase (More Widgets).
<h3>Chart with AJAX Data</h3>


	<s:url id="chartDataUrl" action="json-chart-data">
    <sjc:chart id="chartAjax" legendlabelboxbordercolor="#990033" legendposition="ne" legendshow="#ccc" cssstyle="width: 600px; height: 400px;">
    	<sjc:chartdata label="Map -Double, Double-" href="%{chartDataUrl}" list="doubleMap" deferredloading="true" reloadtopics="reloadMap">
    	<sjc:chartdata label="List -ListValue-" href="%{chartDataUrl}" list="objList" listkey="myKey" listvalue="myValue" reloadtopics="reloadList">
    </sjc:chartdata></sjc:chartdata></sjc:chart>
    <sj:a onclicktopics="reloadMap" button="true" buttonicon="ui-icon-refresh">Load/Reload Map</sj:a>
    <sj:a onclicktopics="reloadList" button="true" buttonicon="ui-icon-refresh">Reload List</sj:a>
</s:url>
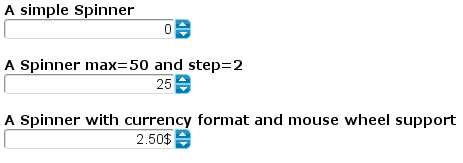
Another new feature is the spinner tag which renders you a simple but usefully spinner for your forms.
<h3>A simple Spinner</h3>
<sj:spinner name="spinner1" id="spinner1"/>
<br/>
<br/>

<h3>A spinner with max=50 and step=2 setting</h3>
<sj:spinner
		name="spinner2"
		id="spinner2"
		min="5"
		max="50"
		step="2"
		value="25"/>
<br/>
<br/>

<h3>A spinner with currency format and mouse wheel support</h3>

<sj:spinner
		name="spinner3"
		id="spinner3"
		min="0.00"
		max="5.00"
		step="0.15"
		value="2.50"
        numberFormat="C"
		mouseWheel="true"/>
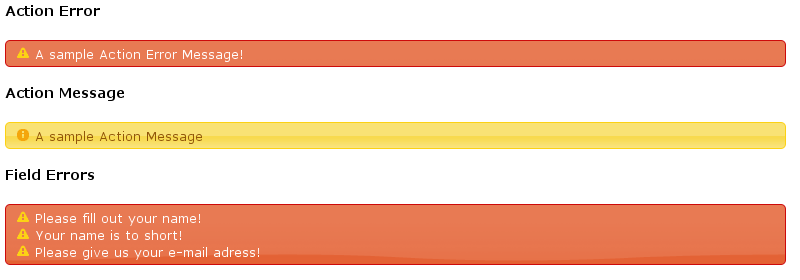
With this version it is also possible to generate your action messages in jQuery UI style, dependent on your theme.
	<h3>Action Error</h3>
	<s:actionerror theme="jquery"/>
	<br/>

	<h3>Action Message</h3>
	<s:actionmessage theme="jquery"/>
	<br/>

	<h3>Field Errors</h3>
	<s:fielderror theme="jquery"/>
	<br/>
jQuery UI is now based on the last stable version 1.8.4 with a lot of bug fixes. When using an own theme, it is recommended to create or update the theme with the themeroller. Also, the ckeditor is updated to new version 3.4 with some new plugins and some bugfixes.
For a complete list of changes since last version, please visit the Changelog.
Download: https://oss.sonatype.org/content/groups/staging/com/jgeppert/struts2/jquery/
Showcase: https://struts.jgeppert.com/struts2-jquery-showcase/
Issues: https://github.com/struts-community-plugins/struts2-jquery/issues
User Group: https://groups.google.com/group/struts2-jquery
Hi,
Is it possible to use i18n with a grid. I would like to have different column names according to selected locale.
Regards,
Javanus
you can use ognl for this.
Hey, I just want to drop a “Thank You”. Did you ever think about using Flattr? I would press the flattr button on every update 😉
Nice to hear, until now I did not know Flattr. 🙂
Pingback:Pie Charts and Grid Grouping with new Struts jQuery Plugin 2.5.0 | Java, Webprogrammierung, Linux und mehr
I am absolutely struggling with this.
I am pretty new to Struts.
I have a table in a database which i want to turn into a graph.
To make things easier I have been able to turn the table data into a json object in a method within the action.java file.
I am absolutely struggling to turn this data into a bar chart using the example give. This is my last resort. can you help?
Just a simple step by step example, what is required in the Action.java and the jsp with just one chart. I have all the plugin in the maven repo. I am just really struggling to get this working.
Can you help?